Creating a Graphic Template

Scenario: You have a device based on a function and want to view details of the subpoints of that device. The devices are resolved from the Management View.

In this example, you want to click your Detection node in System Browser and have a graphic open in the Primary pane and display information from the objects below it. We will create the example below:


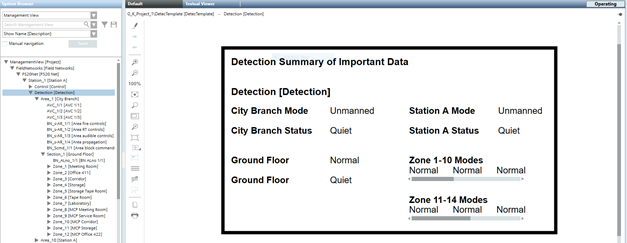
In this workflow you will apply evaluations on the text string property of the Text element to:

  • Resolve the parent node name from the Management View.
  • Reference properties from the object model.
  • Replicate and display the Mode property from the zones by resolving the properties from the Automatic Zones 1-10 and 11-14.


Workflow diagram:


Reference:

  • For background information on Graphic Templates, see Graphic Templates.
  • For background information on Functions, see Object Models & Functions


Prerequisites:

  • You have completed the following from the Creating New Function workflow:
    • You created a Function folder in the L4 Project Library.
    • You created a new function and, for the sake of this example, called it DetectFunction.
  • You have associated the objects to the function. See Object Configuration.


1 – Create a Graphic Template
  • You have created the Graphic Templates library folder in your project directory.
  1. In System Browser, select Management View.
  1. Select Project > System Settings.
  1. Click the Libraries folder.
  • The libraries sub-folders display.
  1. Navigate to the desired library folder where you want to add your new graphic template, and click its Graphic Templates folder.
  1. Click the Graphics tab.
  • The Graphics toolbar and the Library Browser display.
  1. Click Edit .
  • The Graphics Editor displays.
  1. Click New and select New Graphic Template.
    NOTE: If you choose to create a new graphic template using either the File menu or the Quick Access toolbar, the template will not automatically be saved to the Graphic Templates directory. Instead, when you save the graphic template, you will have to navigate to the graphic template directory.
  • A blank, tabbed graphic template displays in the Graphics Editor work area.
  1. Click Save As .
  • The graphic template is saved to the Graphic Template folder in System Browser, and the Library Browser, and automatically reloads a modified thumbnail. Additionally, the following are created in the Graphic Templates library when you save a graphic template: a .CCT file, and a .PNG file.
2 – Configure Evaluations to Display Subpoint Values
  • You will apply an evaluation to the Text string property to display values of the child object properties. In this case, the parent node is the Detection node. The Text expressions in the evaluations are configured with substitutions that resolve the data point values when the graphic template is called at runtime.
  1. From the ribbon, use the Rectangle element to draw the space for the subpoint static labels and the Text elements to display the corresponding subpoint values. Format as desired.
  1. Create a static text label for each subpoint listed below, by doing the following:
    a. Draw and position a Text element accordingly, and
    b. In the Property Viewer, expand the Text property, and
    c. In the Text field, type the name of the subpoint property.
    d. Repeat until you have all the subpoints for each subpoint below:
  • Detection (node name)
  • City Branch Mode
  • City Branch Status
  • Ground Floor Mode
  • Ground Floor Present Value
  • Zone 1-10 Modes
  • Zone 11-14 Modes
  • Station A Mode
  • Station A Status
  1. For each static label created above, insert and position a Text element to represent the runtime values of the subpoint’s properties.
  1. To resolve the Detection parent node name, select the Text element, and do the following:
    a. Navigate to the Property Viewer > Text group, from the Text Type drop-down menu select Short Reference.
    b. From the Evaluation Editor, in the Property field, make sure Text is selected from the drop-down menu.
    c. In the Expression field, type: “{*}”.
  1. For the City Branch Mode subpoint property, select the associated value Text element you created for it, and do the following:
    a. From the Evaluation Editor, in the Property field, make sure Text is selected from the drop-down menu.
    b. In the Expression field, type: {*}.[m].Area_1;@Mode
  1. For the remaining subpoints and their properties in the table below, repeat Step 5.

Subpoint Object References and Substitutions

Subpoint Labels

Subpoint Object Reference Values

City Branch Mode

{*}.[m].Area_1;@Mode

City Branch Status

{*}.[m].Area_1;@Present Value

Ground Floor Mode

{*}.[m].Area_1.Section_1;.Mode

Ground Floor Present Value

{*}.[m].Area_1.Section_1;.Present_Value

Zone 1-10 Modes

{*}.[m].Area_1.Section_1.@AutomaticZone[*];@Mode

Zone 11-14 Modes

{*}.[m].Area_1.Section_1.@ManualZone[*];@Mode

Station A Mode

{*}.[m].Area_10;@Mode

Station A Status

{*}.[m].Area_10;@Present Value

  1. Click Save As .
  1. From the Save As dialog box, navigate to the library where you want to save the symbol and in the Name field, type a name for your symbol.
  1. Click Save.


3 – Assign the Graphic Template to a Function
  1. Select the Manual Navigation check box.
  1. Select Project > System Settings > Libraries > object model or function.
    In our example, DetectFunction.
  1. Open the Graphic Templates expander.
  1. Select the corresponding Graphic Templates library.
    In our example: L4 Project Library
  1. Right-click the Graphic Templates library and select Secondary pane.
  • The Secondary pane opens and displays available graphic templates.
  1. Select the graphic template created in the previous procedure and drag it to the Graphic Templates expander.
  1. Right-click the graphic template and select Set as Default.
  1. Click Save .
  • The graphic template is assigned to the object model or function.

NOTE:
During graphics engineering the graphic template designated as the default graphic template is dragged to a data point where the graphic is placed.


4 – Test the Graphic Template

You can test the graphic template by dragging a data point instance from System Browser, into the Value Simulator.


  • The graphic template is open in the work area of the Graphic Editor.
  1. From the Home tab, in the Modes group, click Test mode .
  1. From the Value Simulator view, expand the Automatic section, and check the Run Value Simulator check box.
  1. Expand the Graphic Template section.
  1. From System Browser, navigate to your data point and drag the data point onto the Value Simulator, onto the Object Reference field.
  1. Click Assign.
  • Any elements that have evaluations associated with them, now display the COV values of the data point instance.