Adapting Heating Curve Graphic

Scenario: 
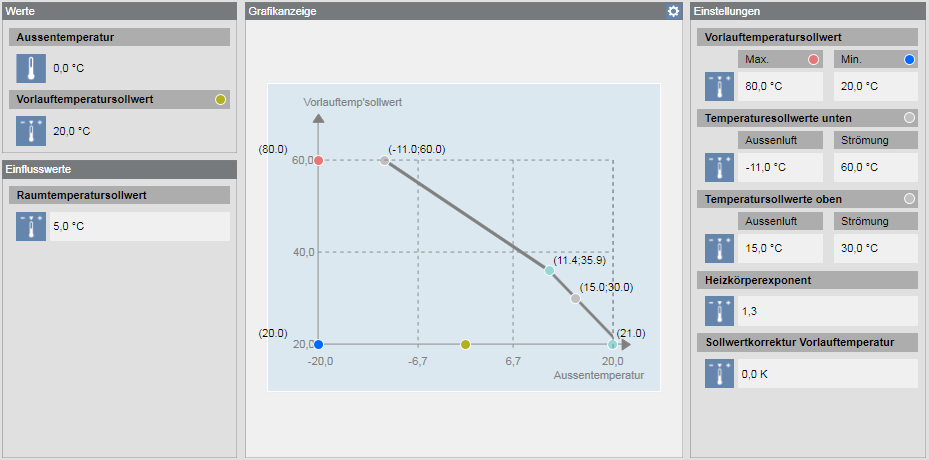
Default values are already saved to the library for the graphical depiction of the heating curve. The default values can be customized by project for each heating curve. The heating curve can be adapted in operating mode by clicking in the Graphics display header.

Heating Curve

NOTE:
The same workflows can also be used for Char Configuration, Summer/winter compensation and TFlCtlHC configuration.


Reference: General information on Desigo PX automation stations is available at Desigo PX.


Flowchart:


Prerequisites:

  • System Manager is in Engineering mode.
  • The System Browser is in Management View.


Steps:

1 – Creating a Project Library
  1. Select Project > System Settings > Libraries > L1-Headquarter > BA > HVAC (PX).
  1. Click Customize the entire library to a lower level .
  • A library file is created specific to the project.
  1. Select Project > System Settings > Libraries > L1-Headquarters > BA > HVAC (PX) > Software Options and then select Hcrv Configuration.
  • The Object Configurator tab displays.
  1. Click Save As .
  1. Select Project > System Settings > Libraries > L4-Project > BA > HVAC (PX) > Software Options.
  1. Enter a description (for example, Hvcr_floor_heating). By default, when you click the Description field, the same text contained in the Name field displays. You can optionally modify this text.
  1. Click OK.
  1. Repeat steps 4‒7, if you require different heating curve configurations for floor heating or radiators.


2 – Defining Values for Heating Curve Graphic
  • The heating curve configuration is created and selected.
  1. In the Settings expander, select the Function, and in the drop-down list the CharCnf option.
  1. Click Save .
  1. In the Operation tab, enter a value for each of the properties and click Change:
  • Y Max (for example, 45)
  • Y Min (for example, 22)
  • Y Precision (for example, 1)
  • X Max (for example, 20)
  • X Min (for example, -18)
  • X Precision (for example, 1)
  1. Repeat steps 1-3 for each heating curve configuration.

NOTE:
The values for Y precision and X precision determine the decimal points displayed (for example, 1 = 20.1)


3 – Assigning Heating Curve Configuration
  1. In System Browser, select Logical view.
  1. Select Logical.
  1. Select the Views tab.
  • Logical displays.
  1. In the Views workspace, select Heating curve [Hcrv].
  1. In System Browser, select Management View.
  1. Select the Manual Navigation check box.
  1. Select Project > System Settings > Libraries > L4-Project > BA > HVAC (PX) > Software Options and then select just created Hcrv Configuration.
  1. Drag-and-drop to create a Softlink from System Browser Heating curve configuration (for example, Hvcr_floor_heating) to Heating curve [Hcrv] under the Views tab.
  • The heating curve configuration displays under the heating curve.
  1. Click Save .
  1. Repeat, with the corresponding heating curve configuration, steps 7‒9 for each heating curve where the graphic display needs to be modified.
Assigning Heating Curve Configuration