Creating a Pipe Diagram

Scenario: 
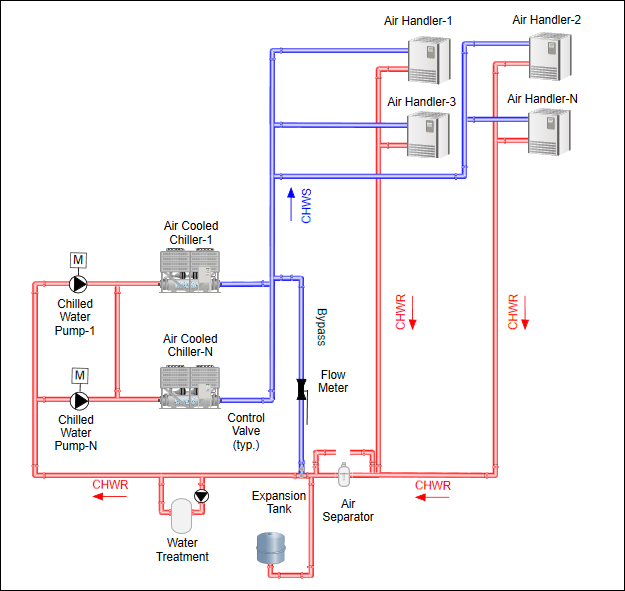
You want to create a .CCG piping diagram based on either a hard copy or an electronic wireframe or blueprint to display your hot and cold water flow. For example:


Use the Graphic Editor’s Pipe and Pipe Coupling elements to draw the pipe objects. There are a number of ways to plan and organize your work and how to approach the diagram. This workflow is merely a suggestion and more a guide on how to use the pipe and pipe coupling elements to achieve the goal of creating a piping diagram.

In planning the graphic, you may consider the following layers:

  • Imported wireframe or blueprint, if any.
  • Pipe elements – Optionally, you can have two pipe layers: one for hot water pipes and one for the cold water pipes.
  • Symbols – Equipment, Pumps, devices, etc.
  • Text – Headers, labels for equipment, directional arrows, etc.

The workflow and the order of the steps below are a recommendations on how to draw and construct a pipe diagram--like the example above--and are intended more to familiarize you with the piping elements and how best to work with them.


Reference:


Workflow diagram (Recommended):


Steps:

1 – Create a Background Layer
  • System Manager is in Engineering mode.
  • You have a graphic open and are in Design or Test mode.
  1. Make sure the Element Tree view is visible; from the bottom left side of the view, click Show all Elements .
  • The Element Tree now displays all elements and objects that are placed on the graphic.
  1. With Layer (Layer1) selected, make sure that the Visible checkbox is checked.
  • The layer is visible in the Graphics Editor in Design and Test mode.
  1. Navigate to the Properties view (Layer Properties), expand the General section, and in the Description field, type a name for the layer, for example, Wireframe or Background, etc. .
  1. (Optional) Expand the Layer section, and from the Discipline drop–down menu select an associated discipline. In the future, when the graphic displays in the Graphics Viewer, you can sort the layers by discipline.
  1. To add the image to the layer, do one of the following:
  • Click to import a standard image file.
  • Click to import an AutoCAD or XML file.
  • Drag a .CCG file and drop it over the Ribbon.
  • The wireframe or background image displays on the canvas.
  1. In the Element Tree, next to the image entry, check the Lock checkbox to lock the image in place.
  1. To create a layer for the Piping:
    a. In the Element Tree, click New Layer .
    b. Repeat Step 3 to name the layer. For example: Piping.
  • You now have a background layer that you can use to guide your pipe drawings. When the diagram is complete and you finalize the diagram, change the layer’s setting so that is not visible in Runtime mode.


2 – Create a Pipe Layer

The suggestion below is based on the above diagram. You can create multiple pipe and Symbol layers for your diagram. Here are some of the options to consider:

  • Both Hot and Cold pipes on one Layer:
    • Use two Pipe elements. One for Hot water and one for Cold water.
    • Select the Hot water Pipe element and shade it Red.
    • Select the Cold water Pipe element and shade it Blue
  • Two Piping Layers:
    • Hot water pipes shaded in Red on one layer – one Pipe element.
    • Cold water pipes shaded in Blue on another layer – one Pipe element.
  • Symbols/images, Text (Labels), and/or Data Points:
    • Same layer as the two pipes.
    • Separate layer for each:
    • Symbols/images only.
    • Text labels
    • Data Points


3 – Prepare a Canvas to Draw Pipes

Each time you work in the Graphics Editor, you are engaged in an Editing session. All the basic canvas settings, outside of formatting elements, are retained during this session. When you exit Desigo CC, those settings are not retained and the next time you open the Graphics Editor the default settings are enabled.

  • Before you create an image, graphic, or Symbol, it is recommended that you perform the following steps to prepare your workspace in the Graphics Editor.
  • You have a graphic open.
  • In the Element Tree view, you want to view all elements placed on the graphic.
  1. Make sure the Element Tree view is visible, and then click Show all Elements .
  1. On the canvas, you want to use the grid lines to position and work with the elements.
    a. Click the graphic, so that the Graphic Properties display in the Property View.
    b. Navigate to the Workspace Properties.
  1. Click the Display Grid check box to view the grid on the graphic.
    a. From the Grid Styles drop-down menu, select Lines.
    b. You can customize the color (X, Y, and Z Grid Color properties) and size (Offset X,Y, and Z properties).


4 – Draw a Straight Pipe Segment
  1. In the Home tab, from the Elements group, click on the Pipe element.
  1. Do one of the following on the canvas:
  • Click and drag the crosshairs cursor to draw a straight Pipe segment.
  • Press CTRL + E and then click and drag the crosshairs to extend the segment without a bend.
  1. Release the mouse button when you are done.
  1. If needed, from the Pipe Properties view, set the following Pipe segment properties:
  • Fitting Type - From the drop-down menu, select a Round end, or a Miter end.
  • Auto Pipe Joint - Click on the checkbox to automatically display the Pipe joints as a segment is drawn.
  • Diameter – Type or use the arrows to set the Pipe segment diameter size. Minimum diameter is 4.
  1. (Optional) To adjust the size of the Pipe element even further, navigate to the Layout Properties, and adjust the Scale Factor until the appropriate dimension is reached.


5 – Apply Color to a Pipe Element

By default a Linear gradient is applied to the Pipe and Pipe Coupling elements to create a 3 dimensional look. Use the Brush Editor gradients stops to apply color.

NOTE: This is a recommendation; there are numerous ways to apply color.

  • You have selected a Pipe or Pipe Coupling element on the canvas.
  1. From the Brush Editor view, click on the first Gradient Stop, and from the color palette, select a color for the pipe.
  • For example, to represent a hot water pipe, select: Red.
  1. Leave the center gradient stop as-is, to retain the 2-dimensional look.
  1. Click on the last gradient stop and from the color palette select the same color, Red.
  • Or, for example, if the pipe is a mixed (hot and cold )water pipe, select Blue.
6 – Extend a Pipe Segment

Extend a Pipe segment from the Start, End, or Vertex handle.

  • You have a pipe segment on the canvas.
  • Click on a Start, End, or Vertex handle and drag the handle accordingly.
7 – Draw a Bend

Draw a bend from a Start and End handle.

NOTE: The graduation of an acute angle may display differently on the installed and the Flex client.

  • You have a Pipe segment on the canvas.
  1. Do one of the following, to draw:
  • A right-angle bend – Check the Snap checkbox from the View tab.
  • An unconstrained bend – Uncheck the Snap checkbox from the View tab.
  1. On the Pipe segment, click on a Start or End handle and drag the crosshair to create a bend.
  1. Release the mouse button when you are done.
8 – Adjust a Pipe Section

You want to lengthen or shorten a section of a Pipe element.

  1. From the View tab, in the Workspace group, make sure the Snap checkbox is not selected.
  • This allows you to un-restrict the angle of the bend.
  1. Click on the Vertex handle and drag it to the desired position.
  1. Enable Snap by clicking in the checkbox.
  • This constrains the angle of the bend, if required.
  1. Press CTRL + E and then drag the Start/End handle of the section and drag to straighten and align the section appropriately.
9 – Draw a Branch

Create a branch from a Midpoint handle.

  • You have a pipe segment on the canvas.
  1. On the Pipe segment, click on the Midpoint handle and drag the crosshair .
  1. Release the mouse button when you are done.
10 – Slide a Branch or Connection Handle

You can move a Branch or Connection handle along a pipe segment, or you can move an entire branch segment.

TIP: For greater precision, from the View tab disable the Snap option.

  • You have a pipe segment on the canvas that has a branch.
  1. To slide a Branch or Connection handle:
  • Click on the Branch or Connection handle and drag it along the segment.
  1. To slide an entire pipe branch segment that is not merged with another pipe segment:
  • On the keyboard, press CTRL + E and then select the Branch handle and drag along the pipe segment until desired location reached.


11 – Draw and Configure a Pipe Coupling
  • You are in Design or Test mode and have a graphic open and want to draw a straight pipe segment.
  1. On the Home tab, from the Elements group, click on the Pipe Coupling element.
  • The mouse pointer changes to crosshair when you move the mouse over the canvas.
  1. On the canvas, click and drag the crosshairs cursor to draw a straight pipe segment.
  1. Release the mouse button when you are done.
  1. On the Pipe Coupling element, click on the Coupling Selector until the appropriate coupling type.
  1. To achieve the correct positioning of the coupling type, if needed, from the Pipe Coupling Properties view, navigate to the Layout section and check the Flip X or Flip Y checkboxes.
  1. From the Pipe Coupling Properties view, set the following Pipe segment properties:
  • Auto Pipe Joint - Click on the checkbox to automatically display the pipe coupling joints as a segment is drawn.
  • Diameter – Type or use the arrows to set the pipe segment diameter size. The minimum allowable diameter is 4.
  1. (Optional) To adjust the size of the Pipe Coupling even further, navigate to the Layout Properties, and adjust the Scale Factor until the appropriate dimension is reached.


12 – Overlay a Pipe Coupling onto a Pipe Element

The procedure below is simply a recommendation. There are many workflows you can use to combine the two elements.

  • You have one or more Pipe elements drawn on the canvas.
  1. Draw a Pipe Coupling on the canvas. (Add the usual crosshair info.)
  1. Format the Pipe Coupling element according the existing Pipe element.
  • Color, diameter, Scale Factor, Transparency, etc.
  1. Drag the Pipe Coupling element to the required position over the existing Pipe element.
  1. Use the Up, Down, Right, and Left keyboard arrows to move the Pipe Coupling element until it is perfectly aligned and in position on top of the Pipe element.
  1. (Optional) To bind the two elements together so they do not separate during further engineering of the graphic:
    a. Press CTRL and then select both the Pipe Coupling and the Pipe element.
    b. Right click on the selection, and from the context menu, select Group.


13 – Repeat Steps as Needed

To complete the piping diagram, repeat the steps above as needed. For additional support and tasks related to working with piping elements, see Additional Pipe Diagram Procedures.


14 – Add Symbols
  • Add Symbols to the piping diagram as needed.

    NOTE: If you are using a Symbol that already contains Pipe elements, you should adjust the size of the Symbol by rescaling the Symbol in order to maintain the piping aspect ratio.
  1. In the Element Tree, select the layer you want to add the Symbol to, or, if the Symbols display on a separate layer, do the following:
  • Click New Layer .
  • Navigate to the Properties view (Layer Properties), expand the General section, and in the Description field, type a name for the layer, for example, Symbols, Equipment etc. .
  1. In the Library Browser, from the Filter Type drop-down menu, click Symbol .
  • A list of all available Symbols displays in the Library Browser view.
  1. In the Type to Filter field, type the name of a specific Symbol.
  1. From the Filter by Library drop-down menu, select a library to search. You can also select <All> to search through all available libraries in your project.
  • The Symbol matches automatically display in the view as you enter the text.
  1. Do one of the following to add a Symbol to a graphic:
  • Right-click the Symbols and click Insert from the menu that displays on right-click. The Symbol is added to the graphic. To select multiple symbols, press the CTRL key and click the Symbols you want to add from the Symbol Browser display.
  • Click the Symbol and drag it to the active graphic.
  • You have a Symbols or Equipment layer, and if you like, you can also create a layer for any text labels, or headers, etc. as needed.


15 – Finalize Piping Diagram

If you created a wireframe or background layer, remove the layer from visibility so that it will not display in Operating mode.

  • With layer selected, uncheck the Visible checkbox.
  • The layer is no longer visible.